114 —Operations
Legacy site monitoring: the four-signal stack for solo shops
Thirty legacy sites, one person, and a Sunday morning that started with a 'checkout broken since Friday' Slack. Four signals would have caught it on Thursday.
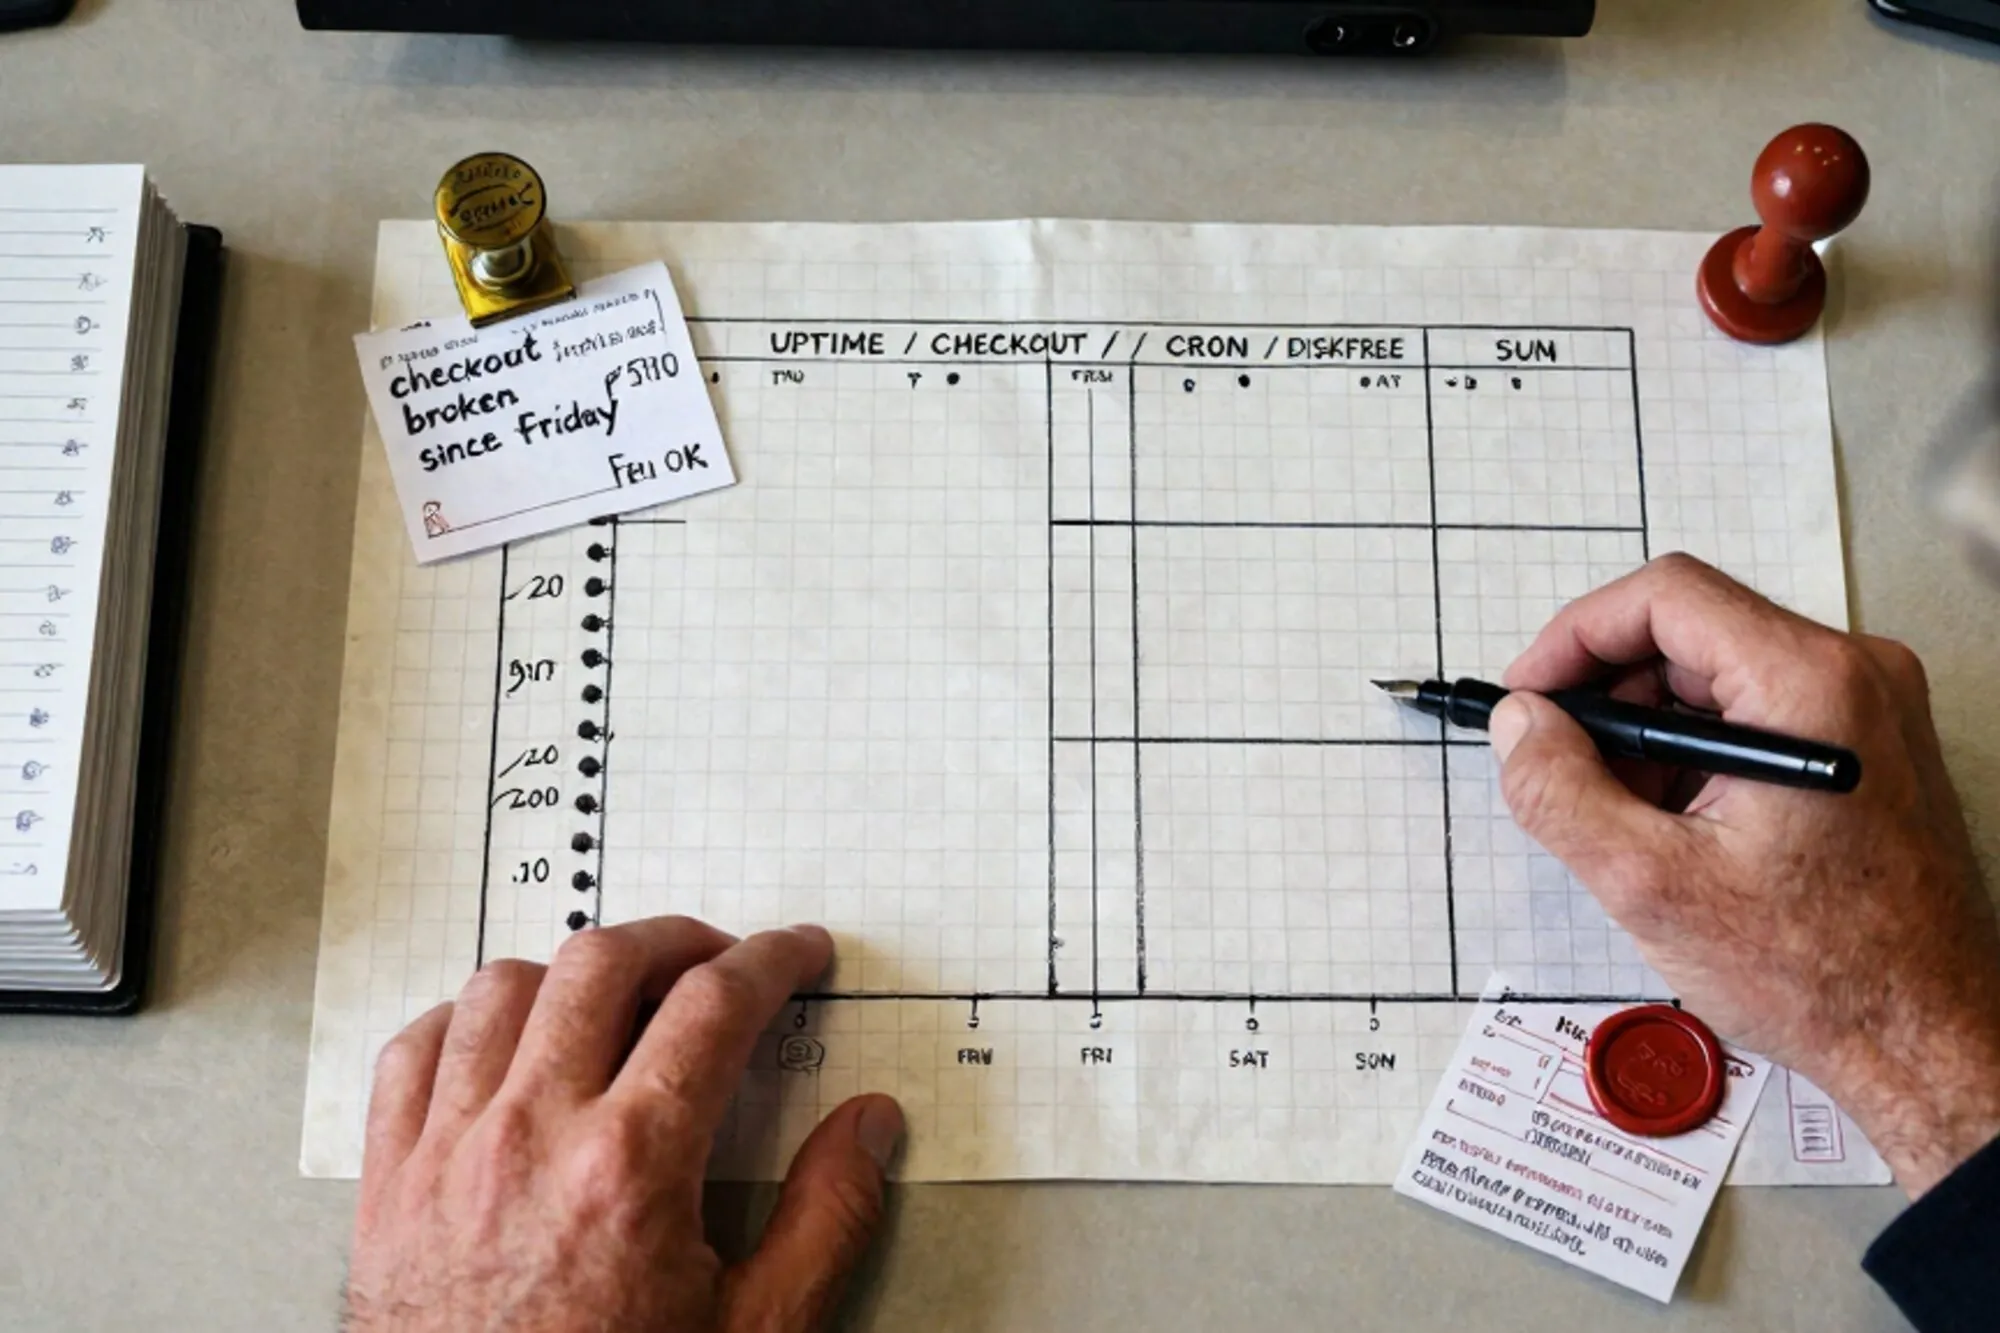
A Sunday in November, 09:14. A Slack ping from a Dutch agency we work with: their client's WooCommerce checkout has been silently failing since Friday afternoon. Two days of orders, gone. The cause, once we got into the box: MySQL binlogs had filled /var/lib/mysql to 99%. The PHP error log had stopped writing on Friday at 16:22. No monitor had caught any of it.
Thirty legacy sites and one person to keep them up. You cannot read every log every morning. What you can do is pick four signals that fail loudly enough to catch the classes of incident that actually happen, then wire them in an afternoon and stop thinking about them.
The four signals that actually matter
In ten years of running other people's WordPress, Drupal, Joomla and Magento installs, almost every emergency we got pulled into came from one of four places:
- The site is down, or returning HTTP 200 with a white page. Uptime, but content-aware.
- Disk filled up. wp-content/uploads, the MySQL data directory, /var/log, or a runaway cache.
- A query started taking 8 seconds. The slowlog catches it long before the customer does.
- Outbound mail started bouncing. Order confirmations, password resets, contact-form replies. Silent until a customer notices.
None of these need Datadog. None of them need a dashboard. They need four loud alarms.
Uptime, content-aware
A plain HTTP 200 check tells you the web server is up. It does not tell you whether wp-config.php has just started throwing a fatal because someone's plugin called a deprecated each() on PHP 8.2. The site returns 200, the page is blank, the checkout is dead.
Two ways to do this without spending money. Self-host Uptime Kuma on a five-euro VPS, or use UptimeRobot's free tier (50 monitors, more than enough for thirty sites with two checks each).
For every site, set up two probes:
curl -s https://example.com/ | grep -q "Add to cart" || alert
curl -sI https://example.com/wp-login.php | grep -q "200 OK" || alert
The first probe catches white-screen-of-death (200 with empty body). The second catches the case where the front page is served from cache but PHP has actually died at parse time, which wp-login.php will reveal because it cannot be cached. Five minutes each, alert on three consecutive failures so you do not get woken at 03:00 by a 30-second CDN blip.
Disk before it kills you
Disk fillup is the single most common cause of "the site just stopped working" tickets on legacy WordPress and Magento boxes. The killers, in order of how often we have seen them:
/var/lib/mysqlbinary logs that nobody set to expirewp-content/uploadswhen a backup plugin writes archives there/var/log/apache2/or/var/log/nginx/when logrotate is broken- Magento
var/cacheandvar/sessionon pre-2.4 installs - Joomla
tmp/if a failed extension upload left a 4GB tarball
A cron job, once a day, is enough:
#!/bin/bash
# /etc/cron.daily/disk-watch
THRESHOLD=85
USAGE=$(df / | awk 'NR==2 {print $5}' | tr -d '%')
if [ "$USAGE" -gt "$THRESHOLD" ]; then
  {
    echo "Disk at ${USAGE}% on $(hostname)"
    echo
    df -h
    echo
    du -sh /var/lib/mysql /var/log /home/*/public_html/wp-content/uploads 2>/dev/null
  } | mail -s "DISK ${USAGE}% $(hostname)" you@yourdomain.tld
fi
Set the threshold at 85, not 95. You want a yawn at lunch, not a fire at midnight. While you are in there, add expire_logs_days = 7 to my.cnf and run logrotate -d /etc/logrotate.conf to confirm rotation is actually working. MySQL's docs on binlog expiry are worth a five-minute read.
MySQL slowlog as a leading indicator
The slowlog is the cheapest production-quality signal you will ever turn on. A query that used to run in 80ms now takes 3.2 seconds because somebody added a plugin that wrote to wp_options with autoload = yes for a 6MB serialized blob. The site is still up. The checkout still works. But every page load is dragging, and in two weeks the host is going to throttle the database.
In my.cnf:
[mysqld]
slow_query_log = 1
slow_query_log_file = /var/log/mysql/slow.log
long_query_time = 2
log_queries_not_using_indexes = 0
Leave log_queries_not_using_indexes off unless you want a wall of WordPress noise. Two seconds is the right threshold for legacy sites. Below that you are reading core WP queries; above that you are reading actual problems.
Once a week, run pt-query-digest:
pt-query-digest /var/log/mysql/slow.log | head -120
The first three queries in the digest are almost always the entire story. On a Magento 1 site we still maintain for a small client, the top slow query for six months was an EAV_ENTITY_ATTRIBUTE join that ran 11 seconds at peak. One covering index, problem gone.
Mail bounces nobody watches
Order confirmations are the silent killer. The site looks fine. The customer pays. No email arrives. They wait two days, then they chargeback. Meanwhile the server has been bouncing because noreply@theirdomain.com lost SPF after a DNS change three weeks ago, and you never knew.
On any Postfix box:
grep "status=bounced" /var/log/mail.log | tail -50
pflogsumm -d today /var/log/mail.log | head -40
pflogsumm gives you a daily summary by sender, recipient, and reason. A weekly cron that mails this digest to yourself catches the slow-build problems before they become a reputation issue. Industry rule of thumb: a bounce rate over 2% damages sender reputation; over 5% and you are heading for a blocklist. SPF and DKIM misconfigurations are the most common cause, and the easiest to fix once you actually see them.
For sites that hand off to a transactional provider, point their bounce webhook at the same alert mailbox and forward anything above your threshold.
Wire it up, then forget it
The whole stack is one VPS running Uptime Kuma, four cron jobs (disk, slowlog digest, mail summary, weekly recap), and a single alert mailbox you actually read. No dashboard. No on-call rotation. Four loud alarms that ring before the customer notices, and silence the rest of the time.
When we built Pier we kept running into the same gap on customer sites: the people who needed monitoring most could not justify the time to set it up, because their tooling for actually fixing the problem (SSH in, find the slow query, patch the bad plugin) was already a ninety-minute round-trip. The way we ended up handling it was to put the fix-it tools, the MySQL editor and a tracked version history on every file, right next to the FTP connection, so a slowlog alert at 14:00 becomes a five-minute fix instead of an evening of work.
Pick one site this afternoon. Enable the slowlog on it, with long_query_time = 2. Tomorrow morning, read the first ten lines of pt-query-digest. You will know more about that site than you did yesterday.
— Questions —
How many uptime monitors do I actually need per site?
Two. One content-match probe on the homepage to catch white screens, and one HTTP 200 check on the login URL to catch PHP parse failures that the page cache hides.
What slow_query_time threshold should I start with?
Two seconds. Below that you read normal WordPress noise; above that you read actual problems. Tighten to one second once the first round of indexing is done.
Do I need a paid monitoring service for 30 legacy sites?
No. UptimeRobot's free tier covers 50 monitors, Uptime Kuma is free to self-host, and the other three signals are cron jobs writing to mail. Total cost is one small VPS.
How often should I read pt-query-digest?
Weekly is enough for stable sites. After any plugin update or theme change, run it the next day. The top three queries are almost always the entire story.
What disk-usage threshold should trigger the alert?
85%, not 95%. The whole point is a quiet warning at lunch instead of a hard outage at midnight. Tune lower if a single backup run uses more than 10% of free space.