130 —Drupal
Drupal watchdog by hand: severity, type, four queries
The dblog admin page caps at 50 rows and aggregates nothing. The watchdog table itself answers the questions the UI cannot. Three columns and four queries.
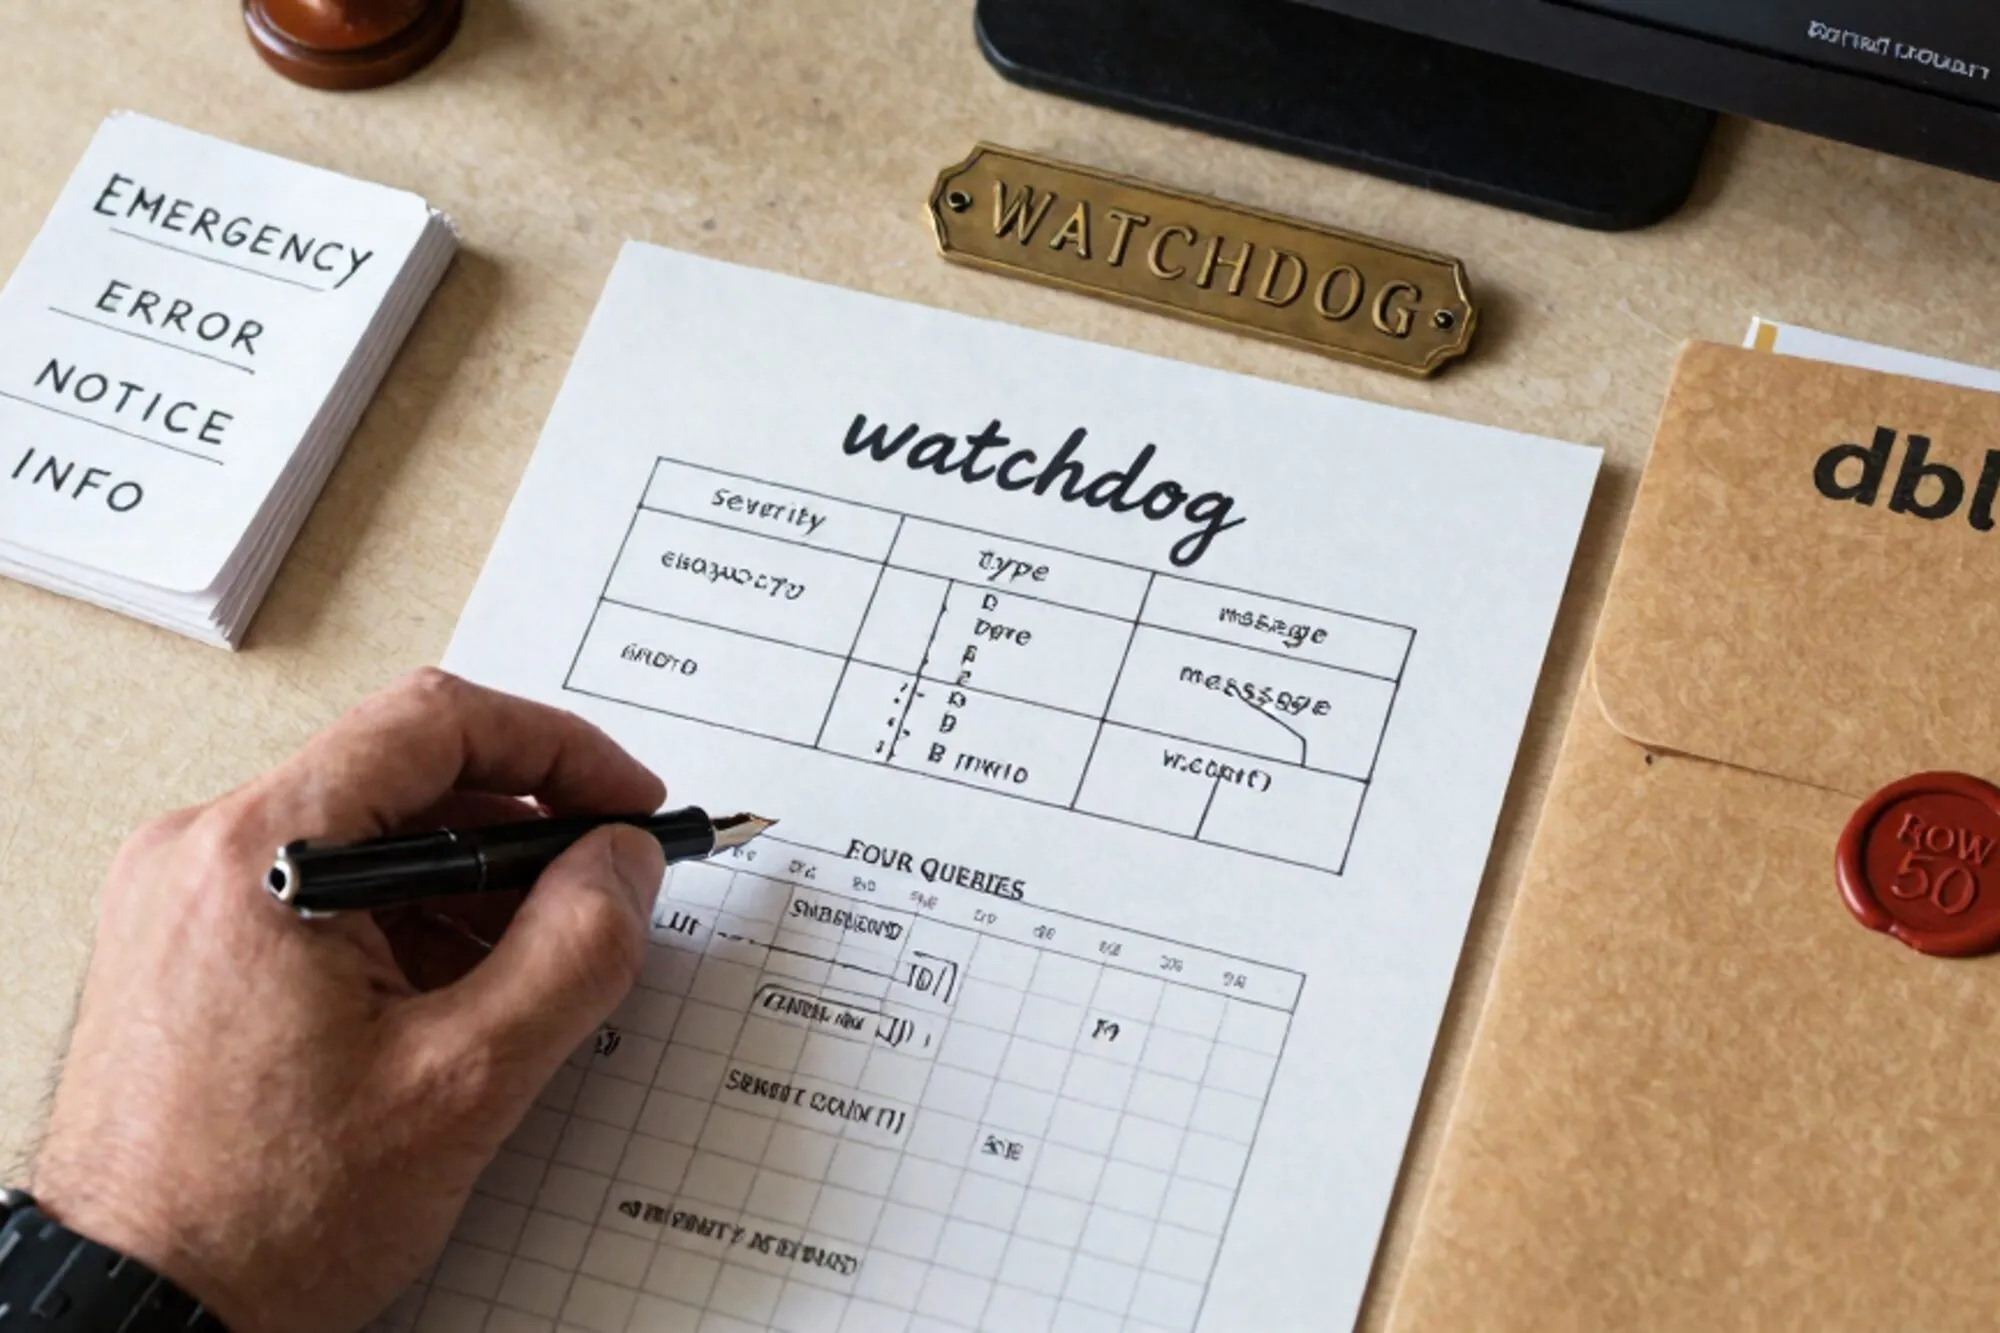
A Drupal 9 site for a Dutch publisher we work with had been throwing intermittent 500s for three weeks before anyone noticed. The dblog admin page at /admin/reports/dblog was useless: 50 rows per page, no aggregation, a wall of "Notice" entries from a module nobody had touched since 2019. The watchdog table itself had 1.4 million rows. Reading the dblog UI was hopeless. Reading the table by hand was a 20-minute job.
The watchdog table at a glance
The watchdog table is written by Drupal core's dblog module. Every variant from Drupal 6 through Drupal 10 carries the same backbone columns: wid, uid, type, message, variables, severity, link, location, referer, hostname, timestamp. The interesting work lives in three of them: type, severity, and message. Everything else is metadata you only need once you have spotted something worth chasing. On Drupal 8, 9, and 10 the schema is unchanged if dblog is enabled, so the queries below work without modification across every supported version.
The message column stores a t() placeholder template, not the rendered text. The substituted values live in variables, serialized PHP. That is why SELECT message FROM watchdog returns cryptic strings like %type: !message in %function (line %line of %file) rather than the readable lines the admin UI shows. Treat message as a fingerprint, not a sentence. Two rows with the same message are the same kind of problem, even when the rendered output looks different to a human.
Severity decoded
Drupal's severity column maps cleanly to RFC 5424 syslog levels. Lower number, higher urgency:
0 Emergency
1 Alert
2 Critical
3 Error
4 Warning
5 Notice
6 Info
7 Debug
Almost every Drupal site I have audited shows the same ratio: 95% of rows sit at severity 5 or 6, 4% at severity 4, and the remaining 1% is where the real problems live. The first thing to do is stop looking at anything above 4. That alone collapses a 1.4-million-row watchdog into something readable in a single screen. The ratio itself is a data point: a site where severity 4 sits at 10% has a different problem to one where severity 3 sits at 8%, and you want to know which you are dealing with before you write a fix.
Four queries that surface real problems
1. Top types in the last 24 hours, bucketed by severity
SELECT type,
       SUM(severity <= 3) AS errors,
       SUM(severity = 4)  AS warnings,
       COUNT(*)            AS total
FROM watchdog
WHERE timestamp > UNIX_TIMESTAMP() - 86400
GROUP BY type
ORDER BY errors DESC, warnings DESC;
This is the orientation query. Run it first. If cron produces 200 errors a day, that is where you go next. If php dominates, the site has a fatal somewhere. If access denied sits in the top three, someone is fingerprinting your admin URLs. The type column is whatever string the calling code passed to watchdog() on Drupal 7 or to the logger channel on Drupal 8 and later, so contrib modules sometimes invent their own type strings. Anything unfamiliar in the top of this list is a lead worth following.
2. Recurring PHP errors, collapsed by message fingerprint
SELECT message,
       COUNT(*) AS hits,
       MAX(FROM_UNIXTIME(timestamp)) AS last_seen
FROM watchdog
WHERE type = 'php'
  AND severity <= 3
  AND timestamp > UNIX_TIMESTAMP() - 7 * 86400
GROUP BY message
ORDER BY hits DESC
LIMIT 20;
PHP errors fingerprint cleanly because Drupal stores the placeholder template, not the rendered string. A row of Trying to access array offset on value of type null in %function() (line %line of %file) repeating 8,400 times in a week is one bug, in one file, on one line. Pull one row, unserialize variables, and you have the file path and line number to fix. The hit count tells you how badly it is firing, and the last_seen timestamp tells you whether it started after a recent deploy. On the publisher site, the top row turned out to be a deprecated call in a custom block plugin that nobody had exercised under PHP 8.1.
3. The access-denied pattern check
SELECT location,
       COUNT(*) AS hits,
       COUNT(DISTINCT hostname) AS unique_ips
FROM watchdog
WHERE type = 'access denied'
  AND timestamp > UNIX_TIMESTAMP() - 86400
GROUP BY location
ORDER BY hits DESC
LIMIT 20;
This one earns its keep on any public Drupal site. If /user, /user/login, /?q=user, and /admin show up 4,000 times from one IP, that is a credential-stuffing run. If the same volume is spread across 800 hostnames, that is a botnet. Either pattern is grounds to add an .htaccess rule or a fail2ban filter before the next escalation. The page not found type works the same way: same query, different filter, and the result is usually a 404 sweep looking for wp-login.php on a Drupal site, which is its own kind of useful signal.
4. Cron health check
SELECT type, severity, message, FROM_UNIXTIME(timestamp) AS at
FROM watchdog
WHERE type IN ('cron', 'system')
  AND severity <= 4
  AND timestamp > UNIX_TIMESTAMP() - 7 * 86400
ORDER BY timestamp DESC;
Silent cron failure is the most common Drupal problem nobody notices. Search indexes go stale, queues back up, the sitemap stops regenerating, and the status report at /admin/reports/status cheerfully announces "Last run 14 weeks ago." If this query returns warnings or errors, cron is firing but a hook_cron implementation is throwing partway through. If it returns nothing and the status page still says weeks ago, cron is not being triggered at all and the problem is on the server, not in the Drupal code.
Reading the results
Each of the four queries answers a different question, but the workflow is the same: run query 1, pick the loudest type, run the matching follow-up, then unserialize one variables blob to get a file path and a line number. Do not try to read the watchdog linearly. The dblog admin page does that for you, and that is precisely why nobody trusts it.
When we built Pier we ran into this exact thing while helping clean up a legacy site with around 900,000 watchdog rows and an admin UI that timed out before the first page rendered. The way we ended up handling it was to put a MySQL editor in the same window as the file tree, so the query sits next to the .module file the errors are coming from, and every SQL edit lands in the version history alongside the file changes.
Today: open the watchdog on whichever Drupal site has been muttering at you longest, and run query 1. If the top type is anything other than page not found or access denied, you have an afternoon's work ahead, and probably a small win at the end of it.
— Questions —
Should I delete old watchdog rows to speed up the admin UI?
Set the dblog row cap at /admin/config/development/logging instead. Drupal's own cap-and-truncate runs as part of cron once it is enabled, and you keep recent context.
Why does watchdog.message look like a template instead of a sentence?
It stores the t() placeholder string. The substituted values live in the variables column as serialized PHP. That is also what makes message a good fingerprint for grouping repeating errors.
What is the difference between dblog and syslog in Drupal?
Dblog writes to the watchdog table; the syslog module writes to the OS syslog instead. High-traffic sites often move logging to syslog to keep watchdog from ballooning.
Are the severity numbers Drupal-specific?
No. They map to RFC 5424 syslog levels, the same numbers PHP error_log and most Unix log tooling use. Lower number means higher urgency.