127 —Magento
Magento 2 cron_schedule at 14M rows: a Friday postmortem
A Magento 2 shop's cron_schedule table hit 14 million rows on a Friday afternoon. Here is the prune, the lock duration we accepted, and the indexer config that stopped the regrowth.
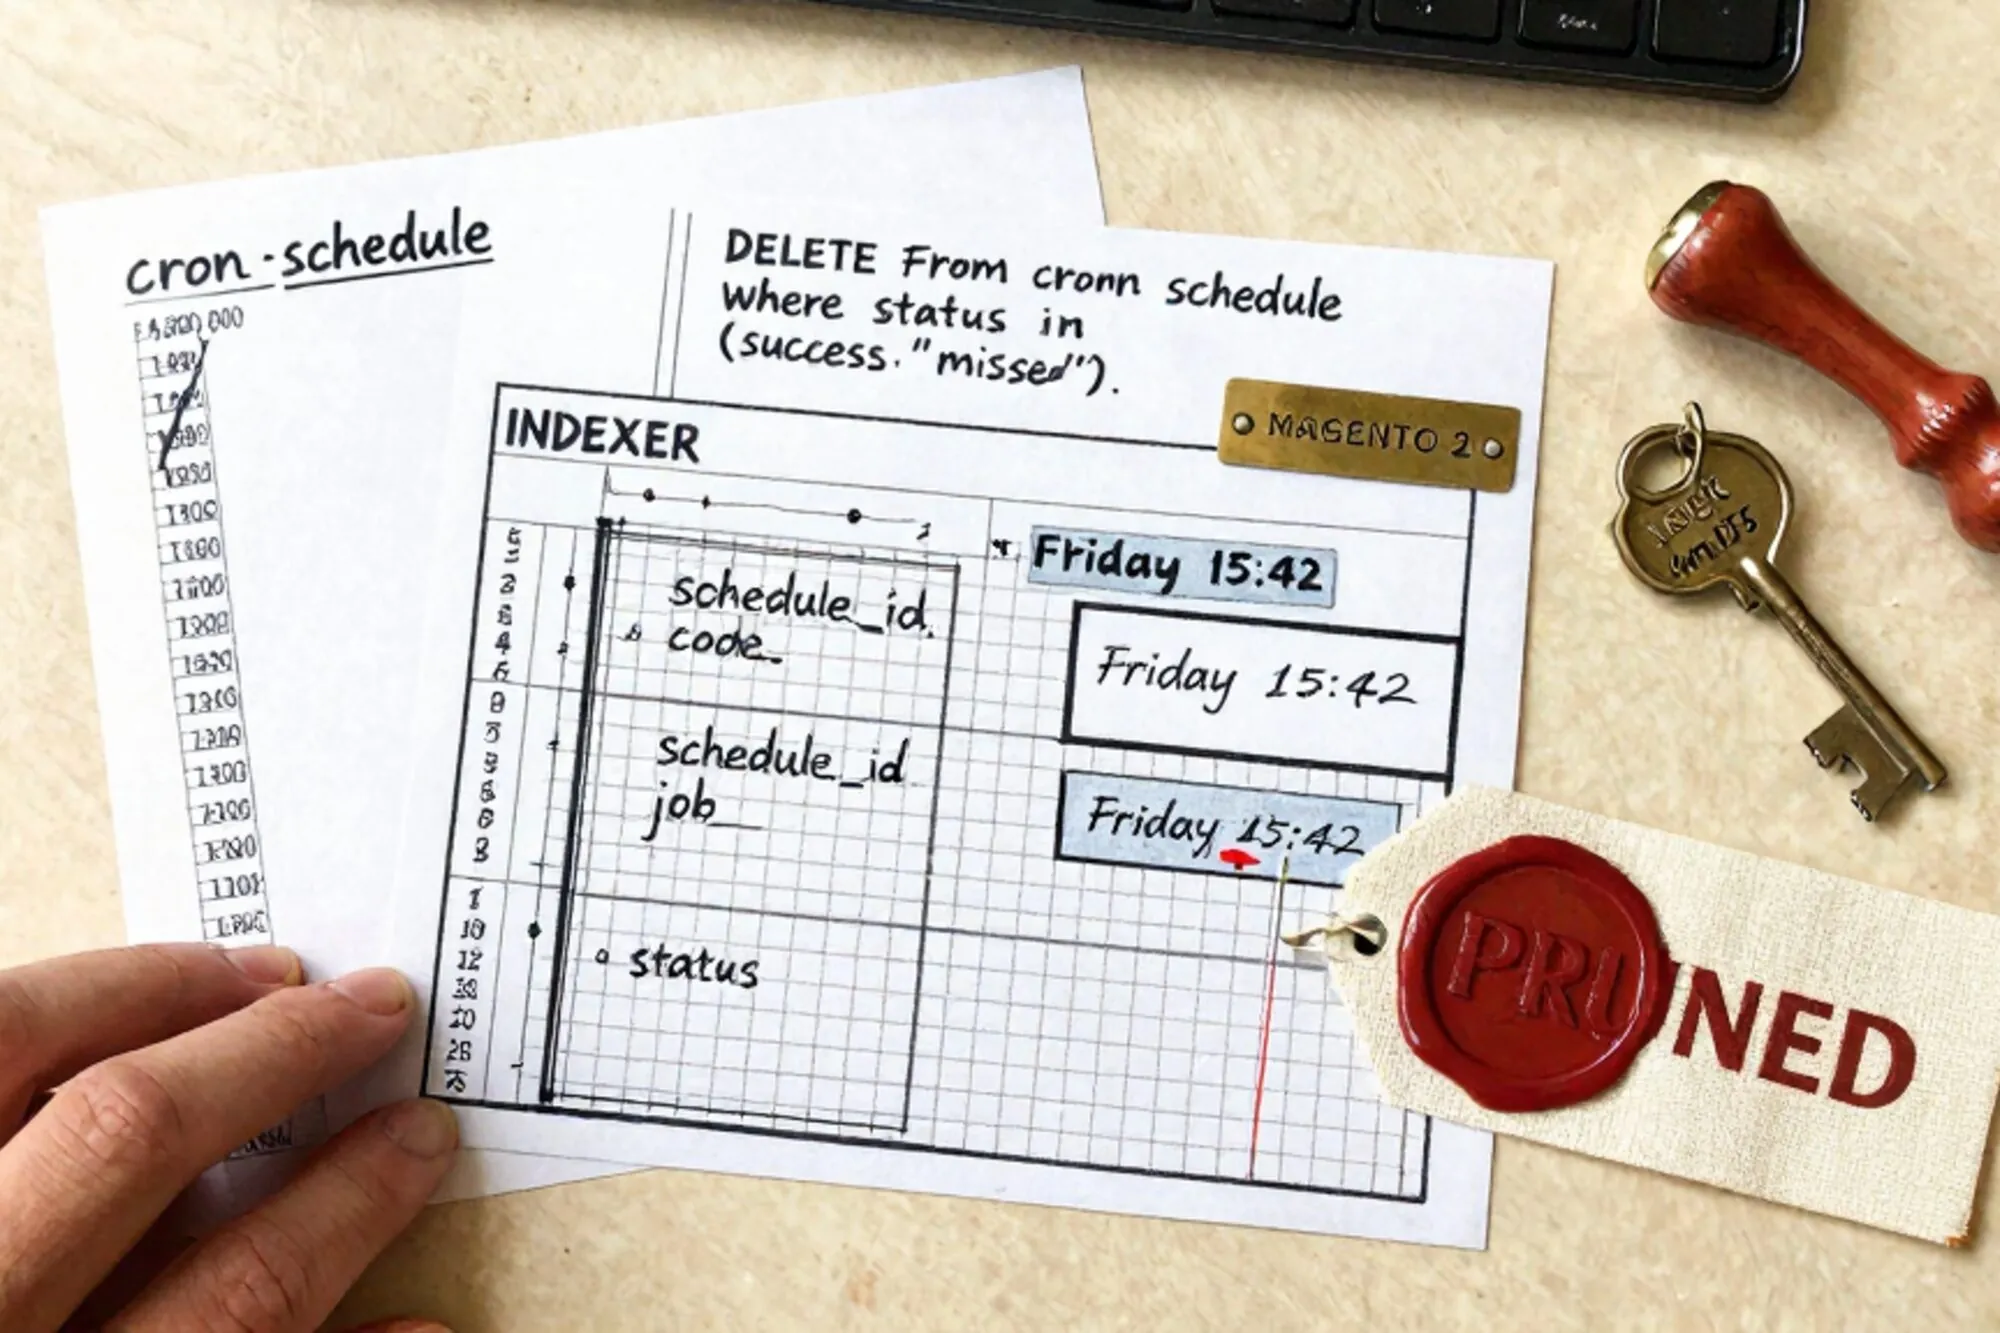
The 16:42 ping
Friday afternoon. A Dutch agency we work with pinged us at 16:42 because their Magento 2.4.6 shop had stopped accepting admin saves. The page would spin for thirty seconds and then return a generic 500. The frontend was technically up, but every category page took eight to twelve seconds to first byte. They have a 22-person ops team, but it was Friday, half the team was already heading home, and the store does a meaningful chunk of its weekend revenue between 18:00 and 22:00.
Before assuming database, we ruled out the front of the stack in ninety seconds. PHP-FPM was at 71% utilisation across its 32 workers, not pinned. Redis answered PING in 0.4 ms and showed 18% memory headroom. Varnish was passing admin traffic through as configured, but its backend timing log showed 28-second waits on every admin route. opcache was warm and not thrashing. The slow lived downstream of PHP, which left one place to look.
The first thing we asked the on-call developer to do was open the MySQL prompt and run a SHOW PROCESSLIST. The output had a tell. Three of the top rows were Sending data against the cron_schedule table, and the oldest one had been running for 412 seconds. The next thing we asked was the row count.
SELECT COUNT(*) FROM cron_schedule;
-- 14,217,883
For context, a healthy Magento 2 cron_schedule table sits between a few hundred and a few thousand rows. Fourteen million is what you get when the built-in cleanup has not run for months and the cron dispatcher has been firing every minute the whole time.
What fourteen million rows in cron_schedule actually means
The cron_schedule table is a queue. Every job declared in a crontab.xml across every installed module gets one row scheduled a few minutes into the future, then transitions through pending, running, and finally success or error. A job called system_cron_clean_history is supposed to delete rows older than the configured lifetime. The cleanup is itself a cron job. If something blocks the cleanup, the table grows. If the table grows past a certain size, the cleanup itself slows down. After that, every cron tick spends more time scanning cron_schedule than doing useful work.
The diagnostic query we always run first on a sick Magento shop:
SELECT status, COUNT(*) AS n
FROM cron_schedule
GROUP BY status
ORDER BY n DESC;

-- pending     11,402,118
-- success      2,701,455
-- missed         108,773
-- error            5,537
Eleven million pending rows is the killer. The Magento cron dispatcher loads pending rows on each tick to decide what to run. Without the right index hit pattern, the planner falls back to a full scan on something that should take five microseconds. Meanwhile a merchant save in admin triggers an indexer reschedule, which writes to cron_schedule, and that INSERT was now sitting behind seven readers. Hence the spinning admin page.
To confirm, we asked the planner what it was actually doing with the dispatcher's read query:
EXPLAIN SELECT * FROM cron_schedule
WHERE status = 'pending' AND scheduled_at <= NOW()
ORDER BY scheduled_at ASC;

-- type:          ALL
-- possible_keys: IDX_STATUS, IDX_SCHEDULED_AT
-- key:           NULL
-- rows:          14217883
-- Extra:         Using where; Using filesort
type: ALL with key: NULL means the planner looked at the indexes, weighed the selectivity, and chose a full table scan anyway. With eleven million of fourteen million rows in the pending state, the status index is useless — the planner correctly decided that scanning the whole table was cheaper than walking an index that returns 80% of rows. The fix is not a better index. The fix is fewer rows.
The prune we ran and the lock we accepted
There are two reasonable ways to delete from a huge InnoDB table. The first is a chunked DELETE in a shell loop. The second is a swap using CREATE TABLE LIKE and RENAME TABLE. The first is safer when many writers are active and you can tolerate hours of grinding. The second is faster but trades a short read-lock for the copy and an atomic flip at the end.
We chose the swap because the cron dispatcher was about to back up the MySQL connection pool past the point where the frontend could open new sessions. The swap looks like this.
CREATE TABLE cron_schedule_new LIKE cron_schedule;

INSERT INTO cron_schedule_new
SELECT * FROM cron_schedule
WHERE scheduled_at > DATE_SUB(NOW(), INTERVAL 6 HOUR)
  AND status IN ('pending','running');

RENAME TABLE
  cron_schedule TO cron_schedule_old,
  cron_schedule_new TO cron_schedule;
Three things matter about this sequence. CREATE LIKE copies the schema with every index, not just the columns. The INSERT SELECT held a read lock on cron_schedule for about 41 seconds on this host, during which the dispatcher's INSERTs queued behind it. The RENAME is atomic and finished in roughly 80 milliseconds. After the rename, the dispatcher's queued INSERTs landed on the new table and life resumed.
The thing we did not do is run a single unbounded DELETE. On 14 million rows, a single DELETE generates an undo log that overruns the InnoDB buffer pool on a 16 GB host, and a kill signal is then itself slow because the undo has to roll back. The MySQL documentation on InnoDB locking is the right reference if you want to understand why a long-running DELETE on a hot queue table is the worst of every world. We have watched that mistake take a Magento shop offline for two hours.
After the swap, admin saves returned in 600 milliseconds. Category page TTFB dropped to 1.2 seconds. We had bought ourselves time to actually fix the root cause.
Why the cleanup was not running
Magento ships built-in pruning. The settings live under Stores, Configuration, Advanced, System, Cron, then per cron group. The two that matter are default and index. Each group exposes the same handful of numbers.
schedule_generate_every, minutes between scheduling wavesschedule_ahead_for, minutes ahead to pre-scheduleschedule_lifetime, minutes a row can be late before it is marked missedhistory_cleanup_every, minutes between cleanup runshistory_success_lifetimeandhistory_failure_lifetime
In this incident, the cleanup was configured at sensible values. The actual problem was that system_cron_clean_history was itself a row in cron_schedule, and every time it tried to run, it loaded all pending rows to find itself in the queue. With 11 million pending rows, that load took longer than the cron tick interval, so the cleanup job got marked missed before it finished, and the next tick scheduled another one. We had thousands of stuck cleanup attempts queued behind each other, each one slower than the last. It is a fully self-reinforcing failure mode.
The downstream effect was the connection pool. MySQL's max_connections on this host was 300. The dispatcher held one connection per stuck cleanup attempt; PHP-FPM workers were each opening one or two more for the admin saves they were trying to flush. The pool sat at 248 when we started looking and had climbed to 287 by the time the swap completed. Another ten or fifteen minutes and admin saves would have been the least of the problems — every new frontend visitor would have hit a SQLSTATE[08004] page because the pool had no slot left to hand them. Queue rot looks like a database problem until it starts eating the connection budget, at which point it looks like an outage.
The config-level fix lives in app/etc/env.php rather than admin, because the agency uses config:dump and ships their env.php under version control.
'system' => [
    'default' => [
        'system' => [
            'cron' => [
                'default' => [
                    'schedule_lifetime'         => '15',
                    'history_cleanup_every'     => '10',
                    'history_success_lifetime'  => '60',
                    'history_failure_lifetime'  => '600',
                ],
                'index' => [
                    'schedule_lifetime'         => '15',
                    'history_cleanup_every'     => '10',
                    'history_success_lifetime'  => '60',
                    'history_failure_lifetime'  => '600',
                ],
            ],
        ],
    ],
],
Then bin/magento app:config:import followed by bin/magento cache:clean config. Sixty minutes of success history and ten hours of failure history is plenty for almost any shop. The defaults that ship with Magento are far more generous, which is part of why this table grows in the first place.
The indexer config that stopped the regrowth
The deeper cause was indexer mode. Magento has two modes per index. realtime reindexes synchronously on every save. schedule writes a change record to a materialized view (mview) table and reindexes out of band. On a shop with frequent product saves, realtime is brutal. Every save reindexes inline, blocks the admin save, and on this shop also queued one cron job per save per index. Twelve indexers multiplied by a few hundred catalog imports per hour was the volume that overran the cleanup.
The right setting for any non-trivial Magento 2 shop is schedule for every index. The supported way to set it from the CLI:
bin/magento indexer:set-mode schedule \
  catalog_product_price \
  catalog_product_attribute \
  catalogrule_product \
  catalogsearch_fulltext \
  catalog_category_product \
  catalog_product_category \
  cataloginventory_stock \
  inventory \
  customer_grid \
  design_config_grid

bin/magento indexer:reindex
The Adobe Commerce documentation on managing indexers covers the per-index trade-offs. The short version: schedule mode writes change records to mview tables and runs the reindex out of band, which keeps cron_schedule from being hammered on every admin save.
The mode flip is recoverable. If indexer:reindex itself errors out or exceeds your maintenance window — usually because an orphan row in a _idx or _replica table makes a JOIN explode — flip the affected index back to realtime with the same command, fix the orphan, and return it to schedule. The mode is one row per index in the indexer_state table; flipping it does not destroy data and does not require maintenance mode. We keep a one-liner in the runbook for exactly that recovery, because the temptation under pressure is to delete the mview tables, which is the one move that does lose data.
The monitoring line we added
The shop had no alerting on cron_schedule size. We added a one-line check to the existing Prometheus mysqld_exporter custom query file.
cron_schedule_rows:
  query: "SELECT COUNT(*) AS rows_total FROM cron_schedule"
  metrics:
    - rows_total:
        usage: GAUGE
        description: "Total rows in Magento cron_schedule"
Alert threshold at 50,000 rows, page at 250,000. Those numbers are generous; the same shop in schedule mode now sits around 4,000 rows on a normal day and peaks near 12,000 during a flash sale.
What we changed in the runbook
Three lines added to the on-call runbook after this incident.
- If a Magento 2 admin save is slow or returning a 500, run
SELECT status, COUNT(*) FROM cron_schedule GROUP BY statusbefore anything else. The answer tells you whether you are looking at queue rot or something else. - For any cron_schedule row count above one million, swap rather than delete. The undo log on a single DELETE will hurt more than the read lock on the copy.
- Every new Magento 2 install gets
indexer:set-mode scheduleon every index during go-live. Realtime is a development convenience, not a production setting.
The agency now does the row-count query as part of their weekly Monday morning health pass, alongside the usual bin/magento setup:db:status and a tail of var/log/exception.log. It takes fifteen seconds.
The smallest thing to do today
When we built Pier we ran into this exact recipe enough times on legacy site work that we baked it in. The MySQL editor ships with a saved query for the cron_schedule status breakdown and a one-click swap-and-rename for the queue tables Magento and WordPress shops accumulate. Every swap goes into the version history, so if the new table has fewer rows than you meant, the previous one is one click back.
If you are reading this because your own cron_schedule has gotten away from you, the single useful thing to do today is open MySQL on your Magento 2 shop and run the COUNT and the status breakdown. Under fifty thousand rows means you have nothing to do. Over a million means schedule a maintenance window before next Friday afternoon, and put every indexer in schedule mode while you are in there.
— Questions —
How big should the Magento 2 cron_schedule table get?
A healthy shop sits between a few hundred and a few thousand rows. Anything above 50,000 is worth an alert. Over a million is an incident waiting for a Friday.
Should I DELETE or swap on a huge cron_schedule table?
For tables over a million rows, swap. CREATE TABLE LIKE plus INSERT SELECT plus RENAME finishes in under two minutes. A single DELETE can generate undo log that hangs MySQL for hours.
Does setting indexers to schedule mode break anything?
No. Schedule mode writes change records to mview tables and reindexes out of band. Admin saves return faster, cron load drops, and the change is reversible per index.
Why does Magento ship with such generous cron history defaults?
The defaults are tuned for low-traffic dev installs where you want to see job history when debugging. Production shops should shorten history_success_lifetime to about 60 minutes.