076 —PHP
PHP-FPM pool tuning: six settings behind the 40-user wall
Your traffic doubles and the site goes white. PHP-FPM workers are pinned at five, the queue is full, Apache is timing out. Here is the cheatsheet.
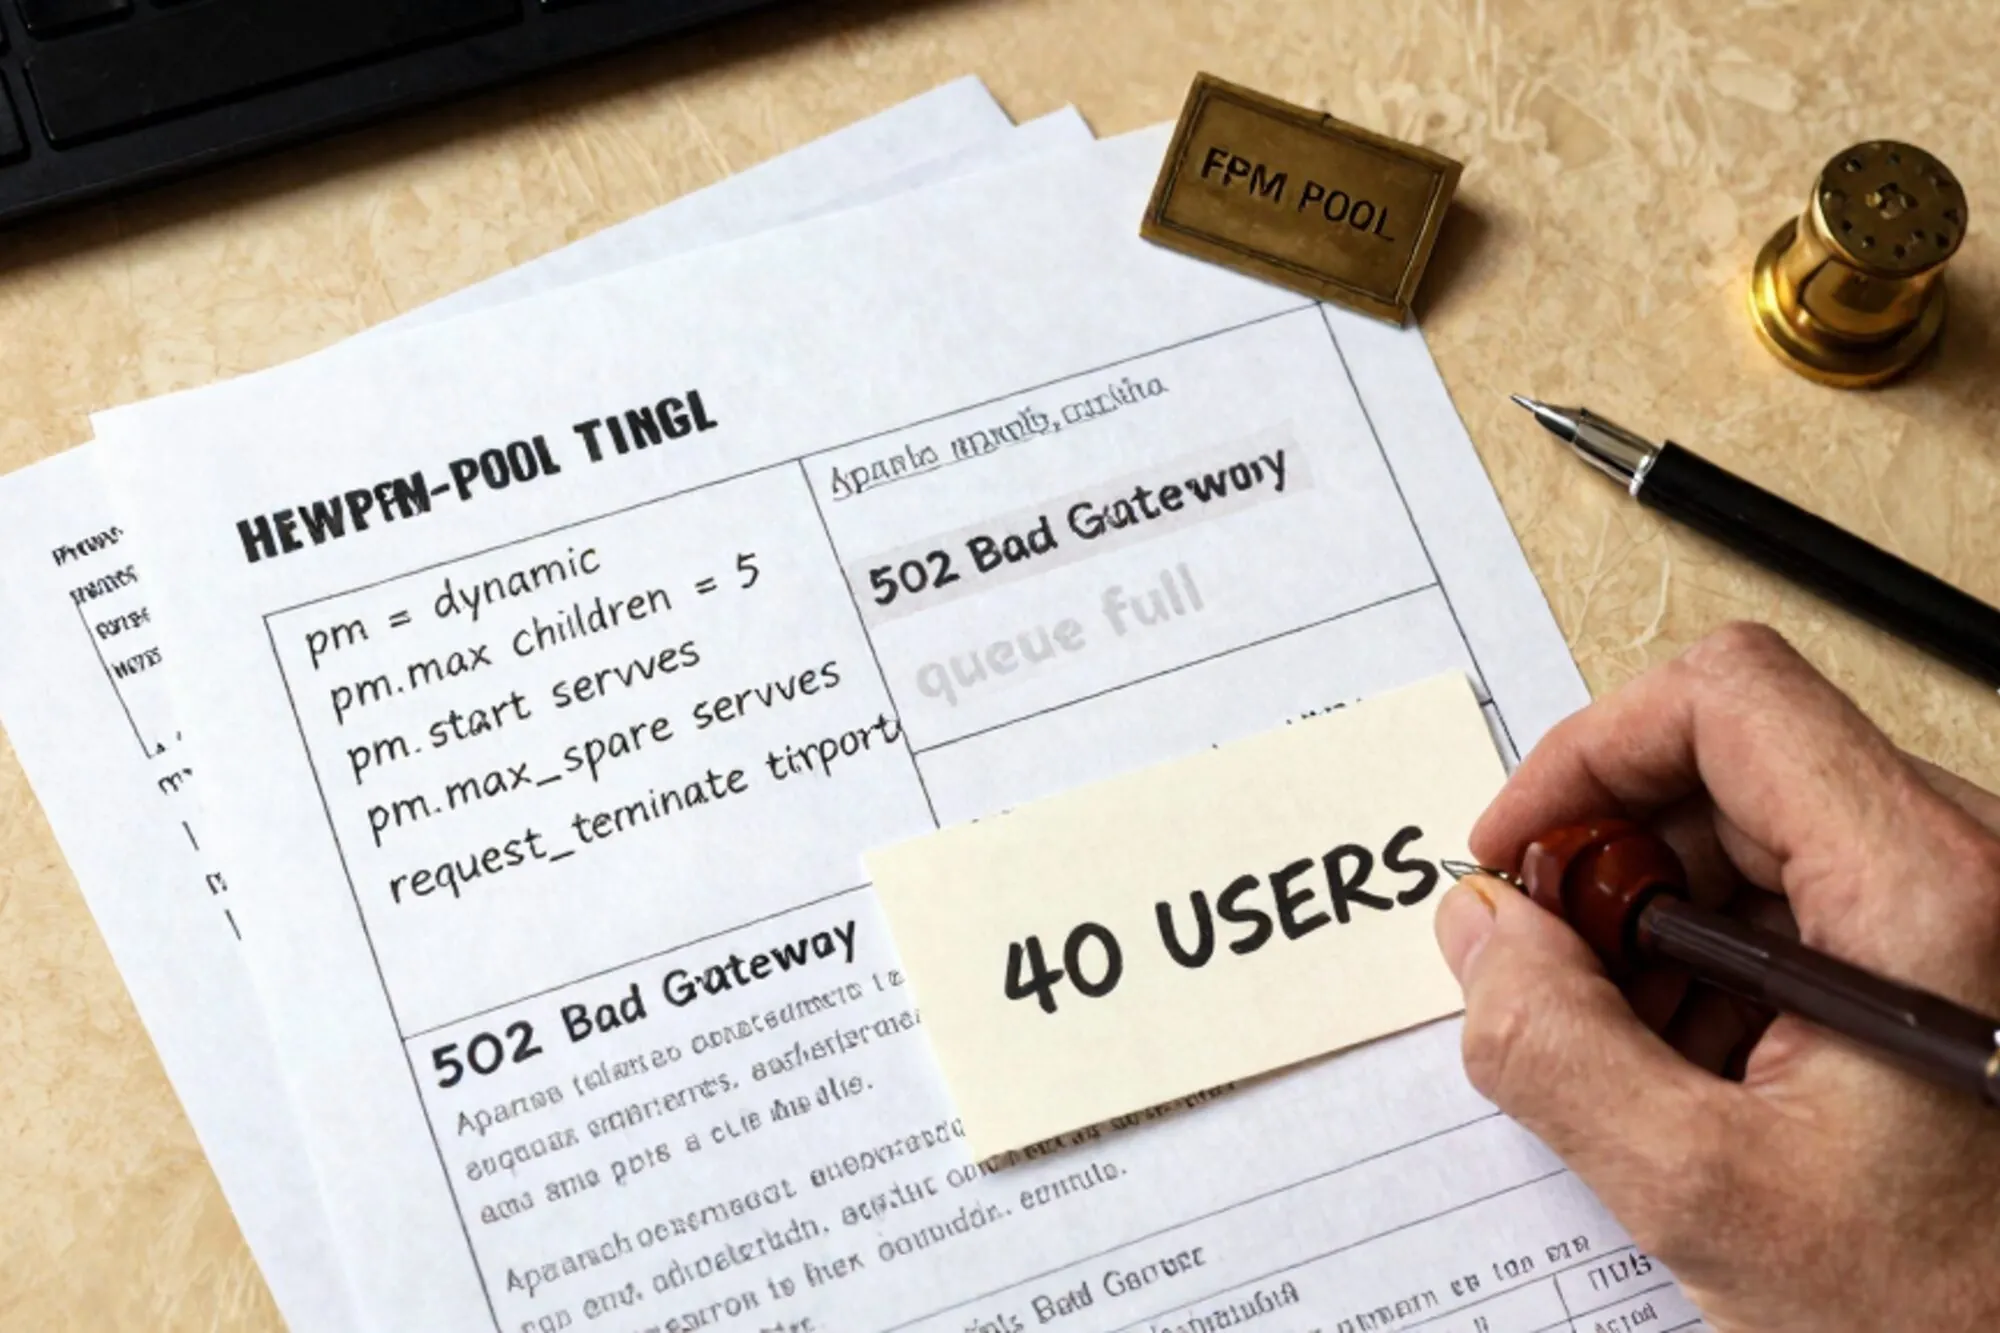
It is 21:14 on a Tuesday. A Dutch agency we work with has just sent a newsletter to forty thousand customers. The WordPress site behind it, a 2018 build on PHP 8.1 running through Apache and php-fpm, was fine all afternoon. Forty seconds after the send, the homepage returns a blank page. htop shows five php-fpm child processes, all RUNNING, none idle. The Apache log is filling with (70007)The timeout specified has expired: AH01075.
The site did not crash. It hit the ceiling of its php-fpm pool, which was sized for one developer testing locally. Six settings in www.conf explain why, and the same six settings get you out of it. Here is the cheatsheet.
pm: static, dynamic, or ondemand
The first line that matters in /etc/php/8.1/fpm/pool.d/www.conf is pm. Three values:
statickeeps a fixed number of workers alive. Predictable, no spin-up cost, wastes RAM when idle.dynamickeeps a band of workers warm and scales between min and max. The default on almost every distro. Reasonable for mixed traffic.ondemandstarts workers only when a request arrives. Saves RAM, but the first request after a quiet minute pays a fork cost.
For a legacy site on a 4 GB VPS, dynamic is right ninety percent of the time. Switch to static only when you have measured your average worker RSS and have RAM to burn. ondemand belongs on shared hosting and staging boxes, not in front of paying customers.
pm.max_children: the actual bottleneck
This is the setting that explains the 40-user wall. pm.max_children is the hard cap on concurrent PHP requests. The default on Debian and Ubuntu is 5. Five. If the average request takes 250 ms, that is twenty requests per second across the whole site, which collapses the moment anyone hits an uncached admin page.
Size it by available RAM divided by average worker RSS:
ps --no-headers -o "rss,cmd" -C php-fpm8.1 | awk '{sum+=$1; n++} END {print sum/n/1024" MB avg"}'If the average is 80 MB and you have 2 GB free for PHP after MySQL and the OS, you can run roughly 2048 / 80 = 25 children. Round down to leave headroom:
pm = dynamic
pm.max_children = 24
pm.start_servers = 6
pm.min_spare_servers = 4
pm.max_spare_servers = 10
Those last three are not separate fights. They are the warmth band around max_children: how many workers you keep idle so a traffic spike does not pay a fork cost. start_servers must sit between min_spare and max_spare, or php-fpm logs a warning and silently overrides you with the midpoint.
pm.max_requests: the leak recycler
Legacy WordPress plugins leak memory. So does old Drupal, so does any custom code that holds a static cache forever. pm.max_requests tells a worker to exit after N requests, freeing whatever it accumulated. The OS reaps it, php-fpm forks a fresh one.
pm.max_requests = 500Five hundred is a safe default for a WordPress front-end. Drop to 200 if you have a known leaker and cannot find it. Leave it at the upstream default of 0 (never recycle) only if you have profiled the workers and confirmed RSS is flat after thousands of requests. That zero is the reason your old box needs a daily systemctl restart cron.
request_terminate_timeout: the slow-request killer
This is the worker-level equivalent of a query timeout. If a PHP request runs longer than request_terminate_timeout, php-fpm sends SIGTERM, then SIGKILL. Without it, a single hung request to admin-ajax.php can occupy a worker for hours, and you watch the pool drain one slot at a time.
request_terminate_timeout = 60sSet it slightly above your slowest legitimate request. For a WordPress front-end, thirty seconds is plenty. For a Magento import that runs through the web, push it to 300s and then move the script to a CLI cron, where it belongs.
request_slowlog_timeout and slowlog
You cannot fix what you cannot see. request_slowlog_timeout writes a PHP stack trace to a log file every time a request crosses the threshold. It is the single most useful debugging tool php-fpm ships with, and most boxes have it switched off.
request_slowlog_timeout = 5s
slowlog = /var/log/php-fpm/www-slow.log
Then tail -f the log during a busy hour. You will see, in plain PHP backtraces, exactly which plugin's wp_remote_get() is blocking for eight seconds on an external API that went away in 2022. Fixing the slow request is usually faster than enlarging the pool.
listen.backlog: the queue you forgot you had
When every worker is busy, new requests sit in a kernel-level socket queue waiting for a free slot. listen.backlog sets the size of that queue. The php-fpm default is 511, but on most distros the kernel's net.core.somaxconn is 128, which silently caps it.
sysctl net.core.somaxconn
# net.core.somaxconn = 128
When the queue fills, Linux drops the connection and the upstream (Apache, nginx) returns a 502. Raise both:
listen.backlog = 1024echo "net.core.somaxconn = 1024" | sudo tee -a /etc/sysctl.d/99-fpm.conf
sudo sysctl -p /etc/sysctl.d/99-fpm.confA bigger backlog does not make the site faster. It buys you a few seconds during a spike so the workers can catch up instead of the load balancer marking the box unhealthy. It is the difference between a brownout and an outage.
Sizing the pool, end to end
Pull the six settings together for a 4 GB VPS running WordPress and MariaDB:
; /etc/php/8.1/fpm/pool.d/www.conf
pm = dynamic
pm.max_children = 24
pm.start_servers = 6
pm.min_spare_servers = 4
pm.max_spare_servers = 10
pm.max_requests = 500
request_terminate_timeout = 60s
request_slowlog_timeout = 5s
slowlog = /var/log/php-fpm/www-slow.log
listen.backlog = 1024
Reload, do not restart, so in-flight requests finish:
sudo systemctl reload php8.1-fpmThen watch the pool under real traffic. The php-fpm pm.status_path endpoint, when you enable it, gives you live numbers on active processes, max children reached, and listen queue depth. Apache's mod_status tells the other side of the same story.
What to do today
Open www.conf on the production box, count the workers, and divide the available RAM by the average RSS. The number you get is almost certainly higher than five. We see this on most legacy site audits we run. When we built Pier we wired the pool config and its current values into the first-pass audit, so the math above happens against the actual box instead of a hunch. The rest is unchanged: edit, reload, watch the slowlog.
— Questions —
How do I pick a safe pm.max_children without crashing the box?
Measure average worker RSS with ps, divide free RAM after MySQL and the OS by it, then round down twenty percent for headroom. Watch the slowlog after the change.
Why does php-fpm ignore my pm.start_servers value?
start_servers must sit between min_spare_servers and max_spare_servers. If it does not, php-fpm logs a warning and silently recomputes it as the midpoint of the spare range.
Does request_terminate_timeout override max_execution_time?
Yes. The pool wins. If php.ini says 300s and the pool says 60s, requests die at sixty seconds with SIGTERM in the fpm log. Set the pool value above your slowest legitimate request.
Is ondemand mode safe for production?
For low-traffic sites on tight RAM, yes. For anything with real traffic the fork cost on the first request after idle adds visible latency. Stick with dynamic unless you have measured the trade-off.